
FIRST STEAMWORKS -- How Are We Doing?
Mar 27, 2017 Written by Frank Merrick.
For the last few years, if I remember correctly, we’ve been sharing community response to the game using data from the post-event surveys that are sent to all teams competing in a given week. The information below is the final survey data from last week, Week 3, which is the most recent complete survey results we have.
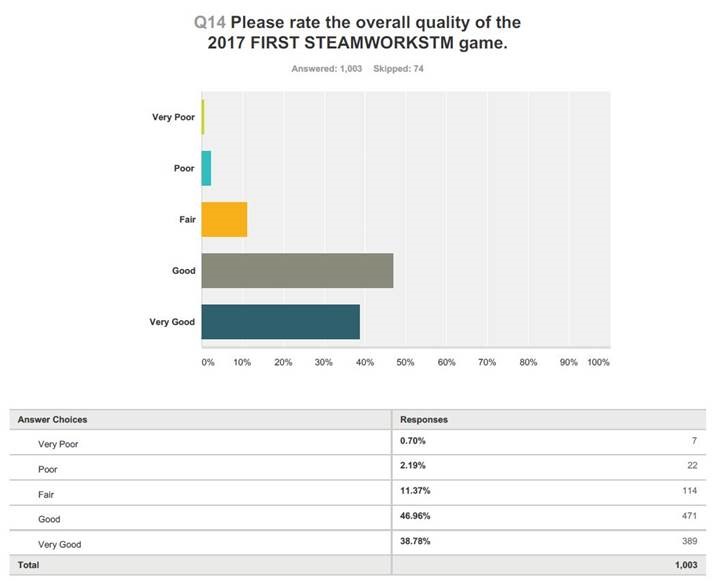
We often group ‘Poor’ and ‘Very Poor’ responses together and call them ‘Unfavorable’, and group ‘Good’ and ‘Very Good’ responses together, and call those ‘Favorable’. Using that approach, last week we had approximately a 3% ‘Unfavorable’ response and approximately an 86% ‘Favorable’ response to the quality of the game. This is not a scientific survey, of course, just a snapshot of the team members who decided to respond to our request for their opinions.
Unfavorable responses have decreased, and Favorable responses have increased, as the weeks have gone by. In Week 1 we showed 10% Unfavorable and 67% Favorable, with 1,142 people responding. In Week 2 we showed 6% Unfavorable and 79% Favorable, with 1,140 people responding. I’m sure lots of things go into how people feel about the game overall, but I’m hoping the tweaks and fixes we’ve been making along the way have helped deliver a good experience to a greater percentage of our teams (whom I consider FIRST’s primary customers) as the weeks have gone by. Clearly, we’d like all our teams to have a ‘Week 3’ or better experience, even if they happen to be competing Week 1. As I noted in this blog, we have plans in place, and are currently executing on those plans, to make things better for 2018.
On to Week 5! More than halfway through the regular season!
Frank

Add new comment